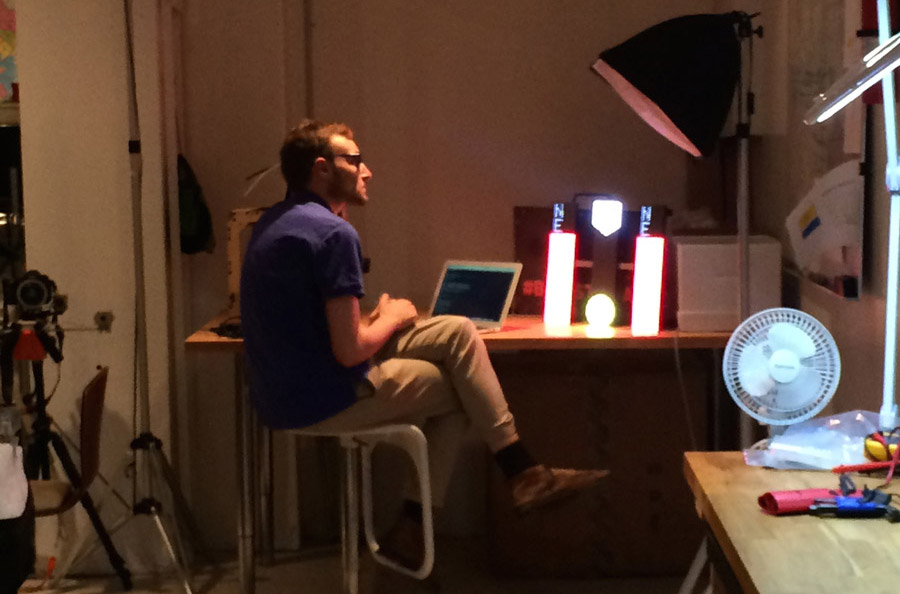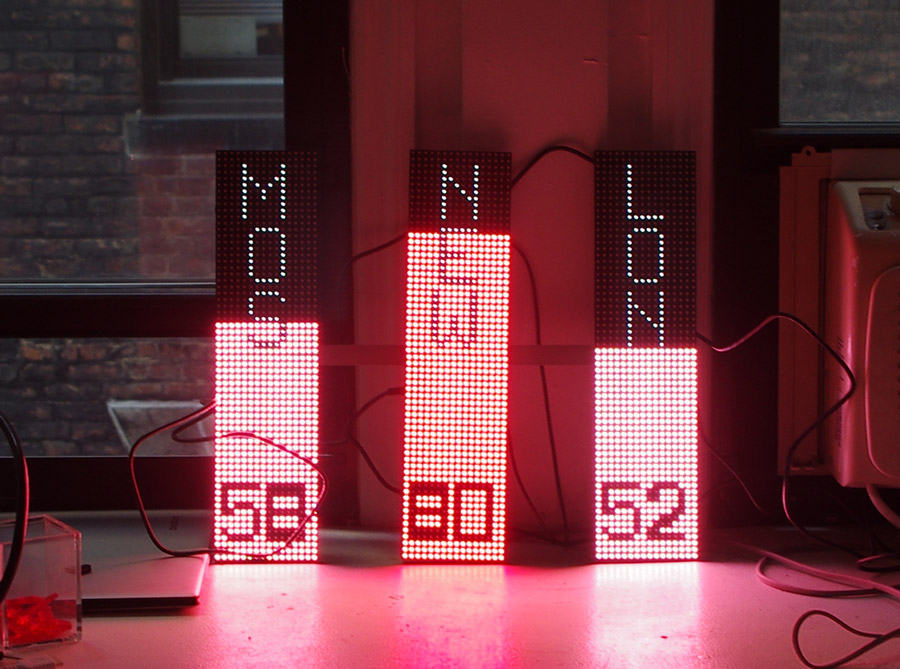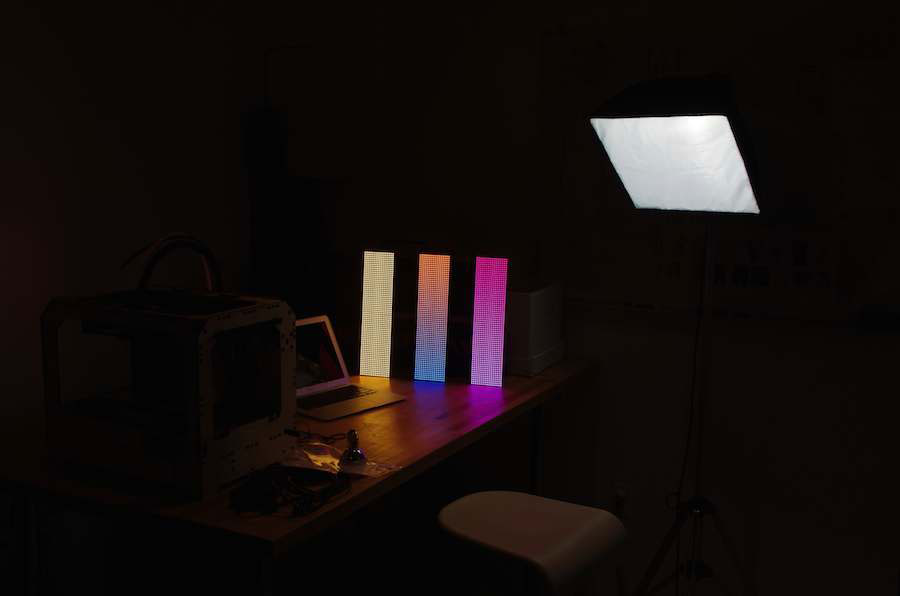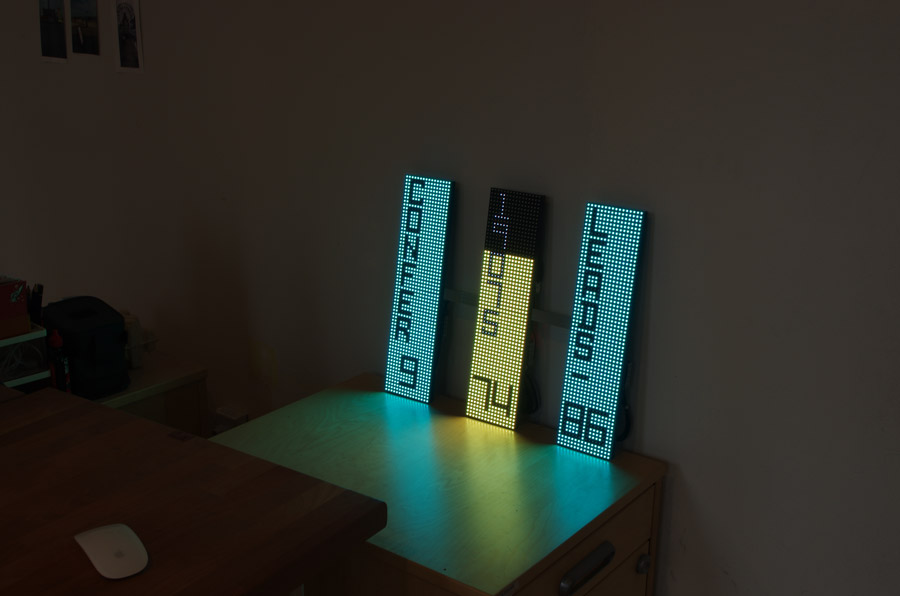
The LittleData is a smart LED display consisting of three vertical bars that pull data from the web and project it. The conceptual core of the project began with exploring how to display minimal but meaningful bits of data (or "little" bits of data) in an intuitive and simple way. The LEDs would receive information and display various messages controllable from a website.
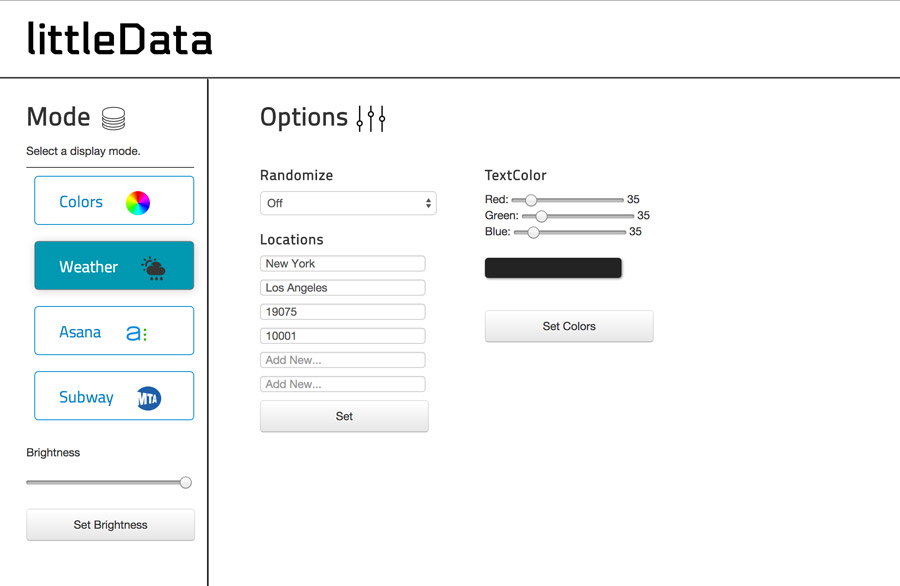
The general architectural concept is simple: a user logs into a web portal, configures specific options, sends a request to a Raspberry Pi web server, which in turn configures its hardware communication code to display the data as the user just configured it.
Software Development
LED Configuration
Product Design
Prototyping
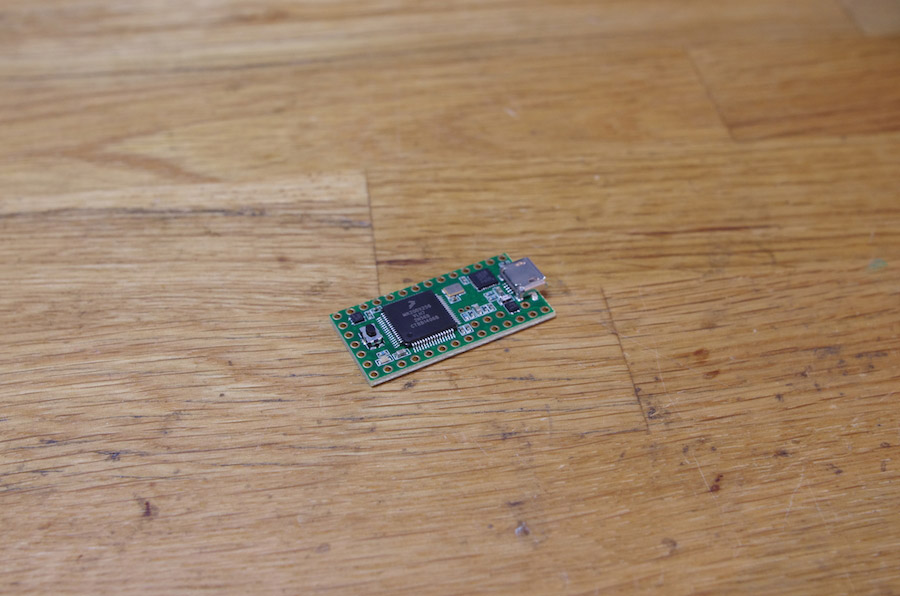
To achieve the initial vision, we had to research the appropriate hardware to use and develop the controller software to compliment it. There are a total of six RGB LED matrices, each vertical bar containing two, allowing for three 16x64 pixel bars. Driving 1024 RGB of unsupported PWM LEDs requires a reasonable amount of processing power, so we chose Teensy 3.1 Cortex M4 processor-based microcontrollers, which run at 72MHz. The Teensy 3.1 boards are similar in character to Arduino (and were programmed using Arduino IDE), though they provide a considerably higher amount of processing horsepower. For more information on the library available about driving LED matrices with the Teensy boards, check out pixelmatrix.
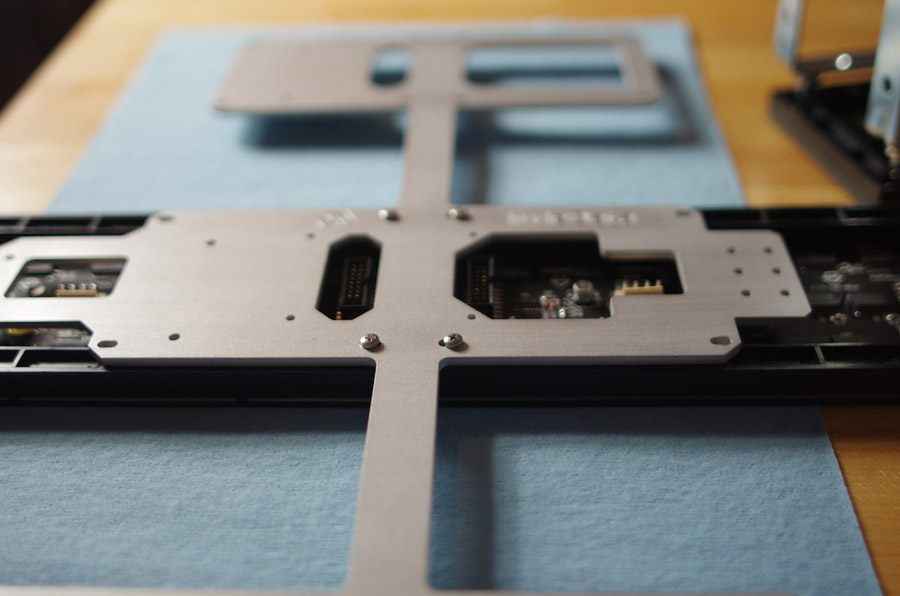
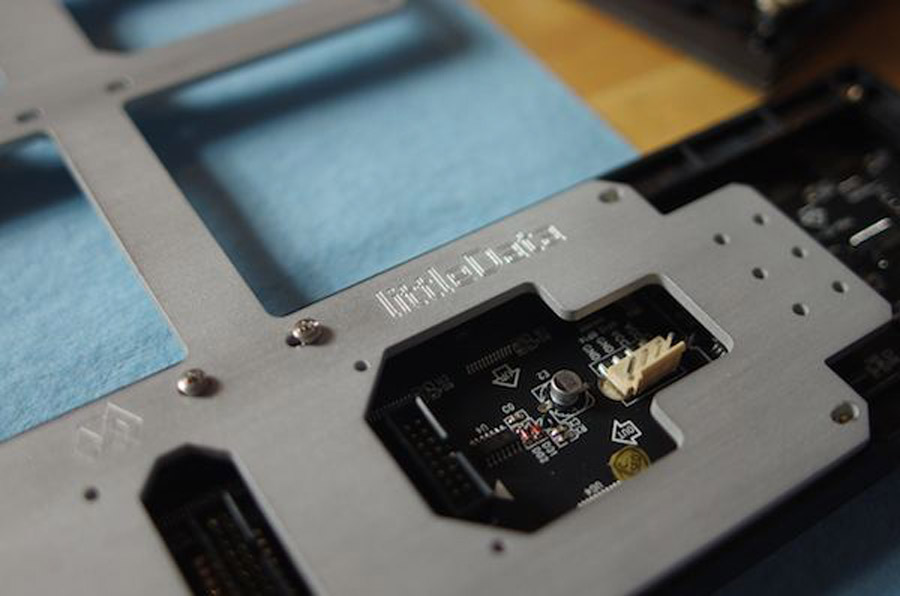
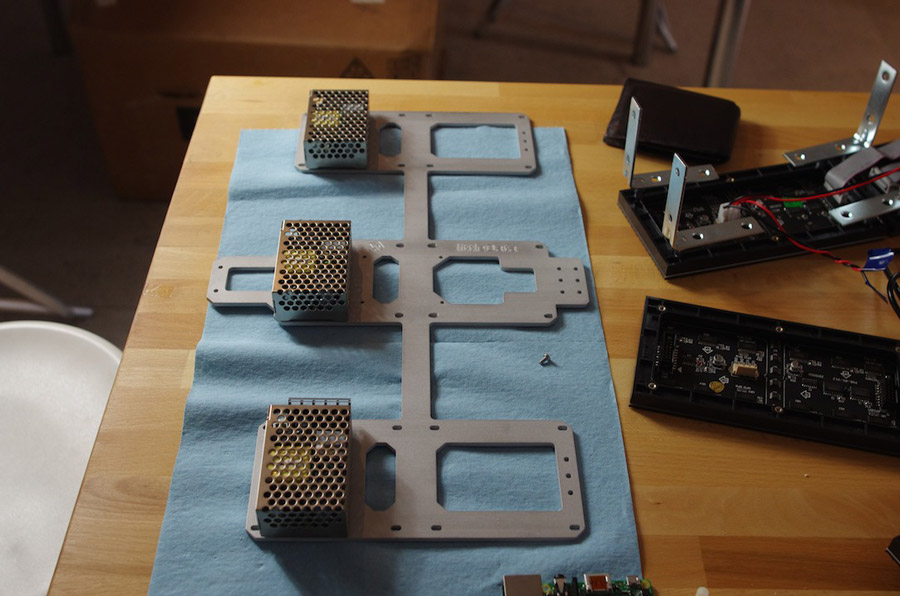
The frame that supports the 3 bars is a single piece of 3/16" aluminum, water jet cut to specifications (and CNC engraved with logo).
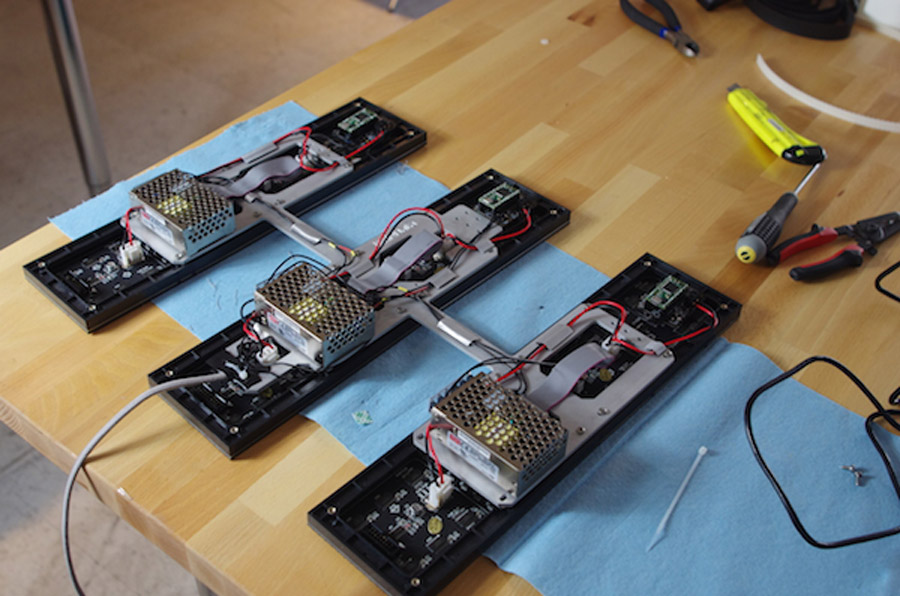
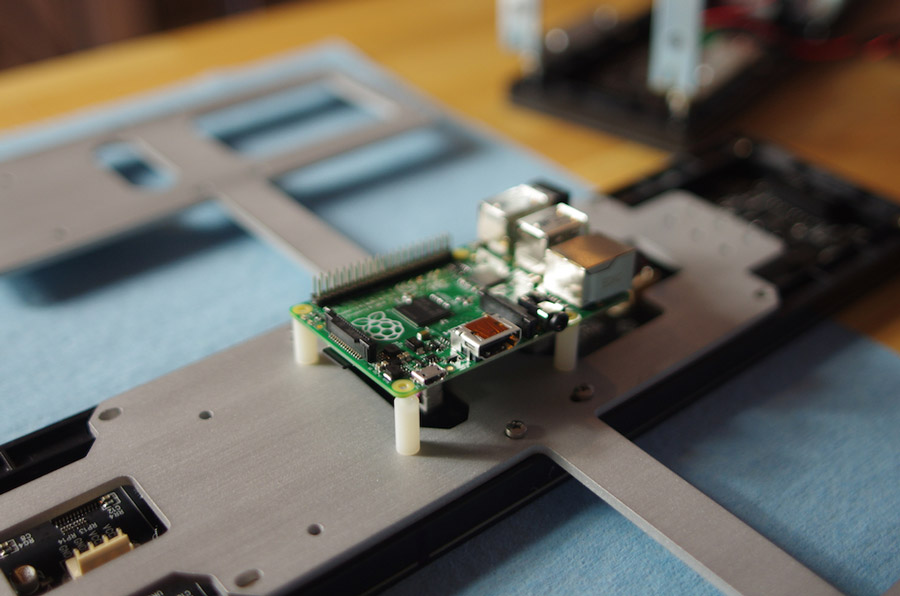
The three displays are controlled from a single, web-connected Raspberry Pi. The Teensy 3.1 boards handle the hardware control at a low level, before receiving display instructions via a customized USB serial communication protocol. For example, we could send a rectangle command to the Teensy over serial and it would draw a rectangle of the specified color and dimensions. With this system in place, the central control can handle other tasks while the Teensy processor is handling the drawing operations. The displays and processors are powered by 3 Meanwell 5Volts/5 Amps power supplies (Meanwell RS-25-5), were mounted on the back of each LED bar. The LED matrices draw a maximum of about 4 Amps each, while the Raspberry Pi a maximum of about 1A, both at 5 Volts.
Finally, we planned to implement a user-facing software interface, which would allow a user to both configure the information and the display with the LEDs. Using Raspberry Pi and the Flask framework, we created a lightweight web server. Because Flask, Teensy, Data API and other components of the electrical engineering are Python-based, it was fairly simple to route a web request to any Python function within the software. The existing display features current weather in any location, as well as a color spectrum display that allows Tomorrow Lab to choose the mood by color and light association.
